pry-byebug gem. Since then, I've switched to the debug gem for all my Ruby debugging needs, and hence re-publishing the updated post.Reading the source code is a great way to understand how a feature works in Rails. However, stepping through the specific Rails method you're interested in is even better. You can inspect the local variables, follow the conditional path, and learn exactly what's happening behind the scenes.
This post shows how you can debug and step-through the Rails codebase for a better understanding of the framework.
Recently, while researching the authenticity tokens in Rails, I wanted to learn how Rails verifies the authenticity tokens.
After reading the API docs, at first glance, the method looks straightforward. Upon receiving a request, Rails checks if the request is verified and calls the handle_unverified_request method if it isn't.
# actionpack/lib/action_controller/metal/request_forgery_protection.rb

def verify_authenticity_token
  mark_for_same_origin_verification!

  if !verified_request?
    logger.warn unverified_request_warning_message if logger && log_warning_on_csrf_failure

    handle_unverified_request
  end
end
Reading the source code of the verified_request? method reveals that a few different checks need to happen to verify a request.
def verified_request? # :doc:
  !protect_against_forgery? || request.get? || request.head? ||
    (valid_request_origin? && any_authenticity_token_valid?)
end
Since Ruby is so readable, you can still read the following code and understand what's going on, but it would be sweet to step inside each method and understand precisely how Rails verifies a request.
How should you follow the execution path for a particular request?
Let's Step-Through the Source Code
Let's say I want to debug and walk-through the verified_request? method. For this, I need to open the source file where that method is defined and insert a breakpoint in it.
Step 1: Open the source file
To open the relevant gem, go to your application in the terminal and run the bundle open gem_name command. Since the verified_request? method is defined in the RequestForgeryProtection module, which is defined in the ActionPack gem, I will open that using the following command.
$ bundle open actionpackAssuming you have configured the EDITOR environment variable, Ruby will open the above gem in the editor so you can inspect the code (I use VS Code). Now you can navigate to the file containing the code you're interested in.
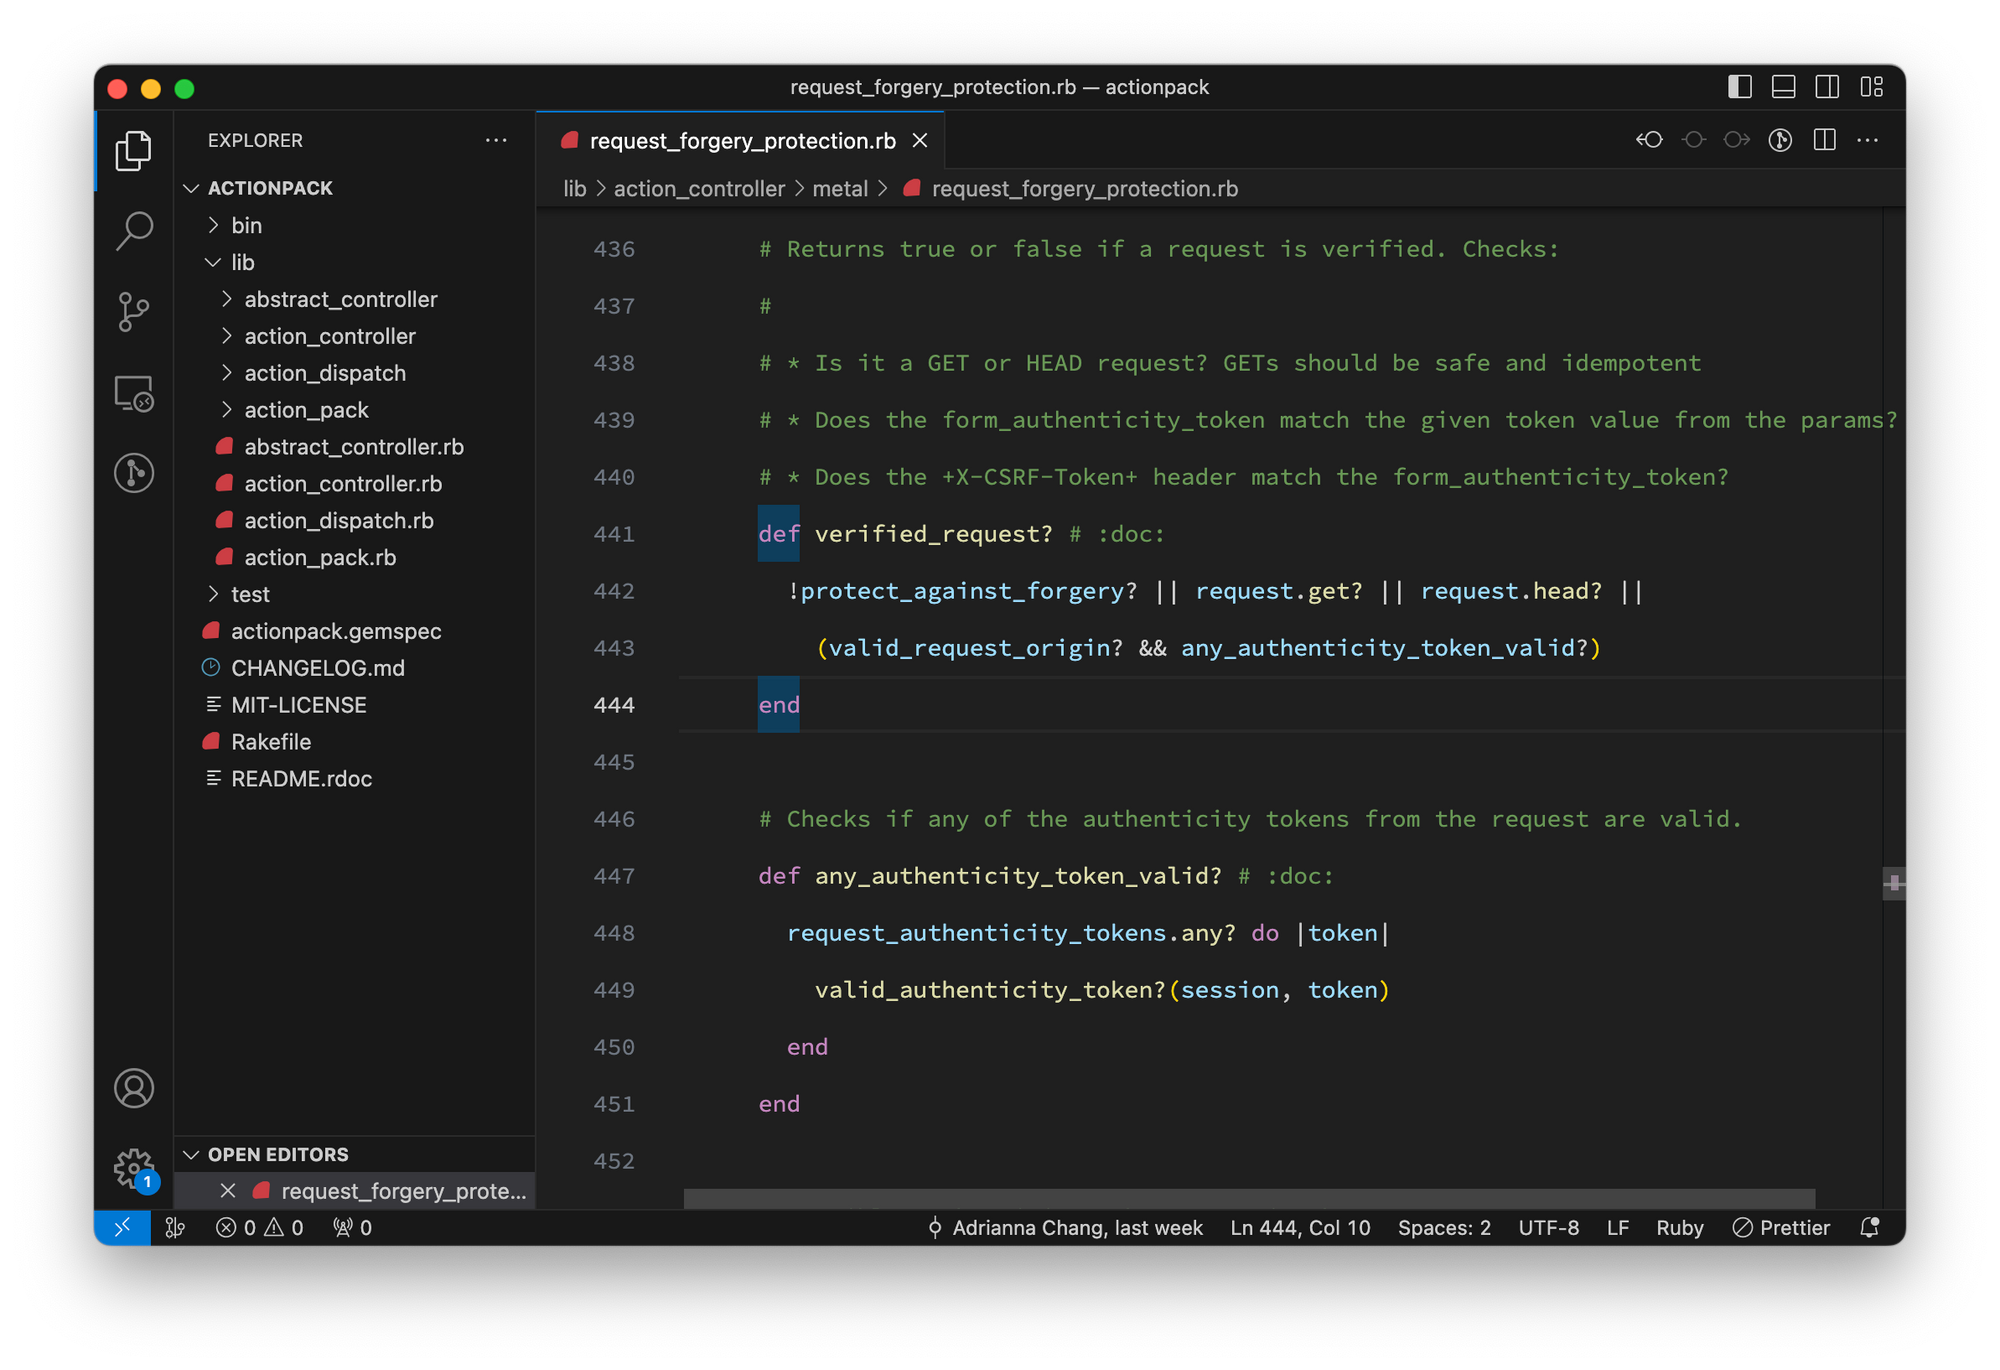
Step 2: Insert a breakpoint
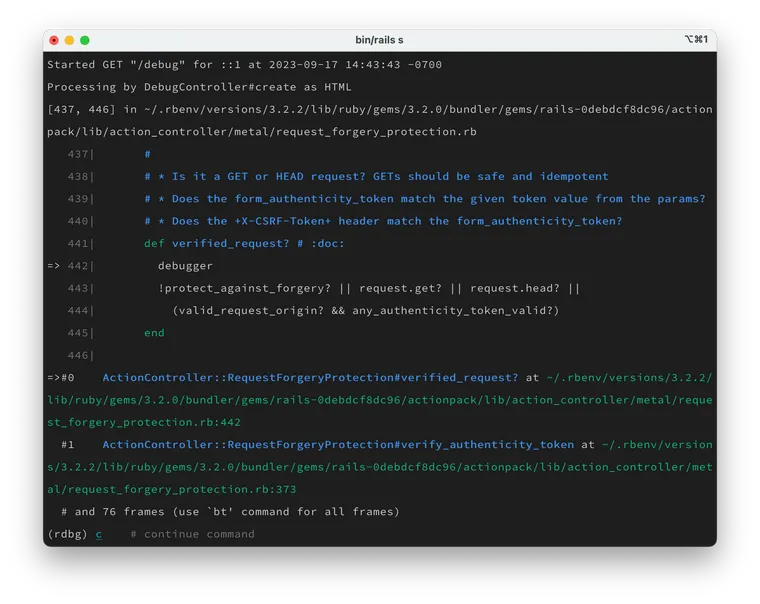
For debugging the method, we need to insert a breakpoint. For this, I will use the debug gem. Rails includes this gem out of the box. For any other codebase, you can run bundle add debug to install and add it to your gemfile. Once set up, you can insert a breakpoint using the debugger statement at the beginning of the method.
def verified_request?
  debugger

  !protect_against_forgery? || request.get? || request.head? ||
    (valid_request_origin? && any_authenticity_token_valid?)
end
That's it. Save the file and restart your application.
Step 3: Step-through the Method
After restarting the application, Rails will load the modified source code containing our breakpoint. Now, whenever you hit the corresponding URL that invokes the feature you're trying to step-through (or debug), Ruby will pause the execution wherever you have placed the breakpoint.
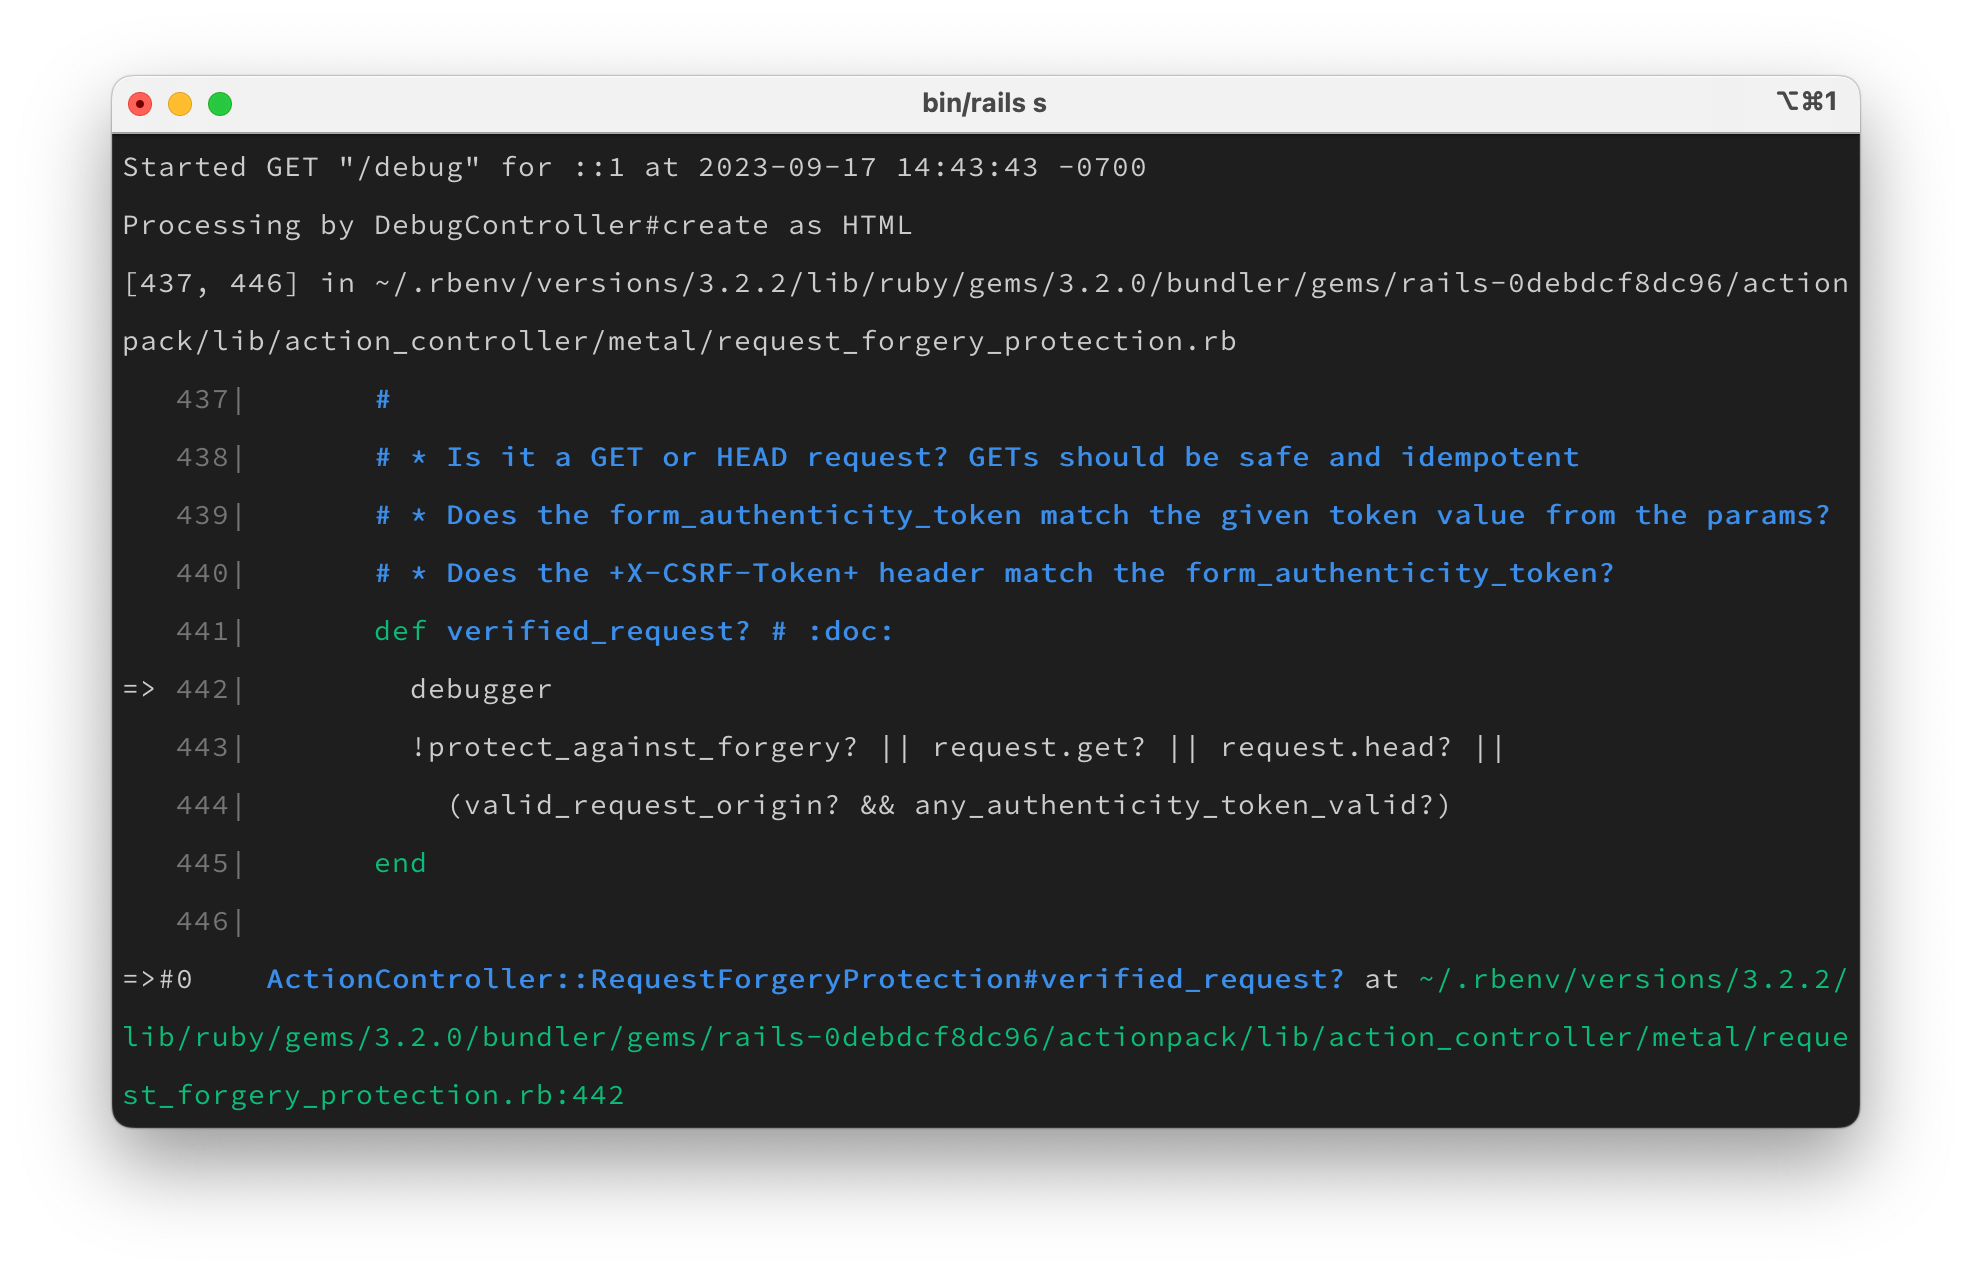
At this point, you are inside the Rails codebase. You can step through the entire Rails source code as you'd in your regular application.
- To step into a method, type
s, - To step out of a method, type
u, - To continue, type
c, etc.
And of course, you have access to all local variables as usual. Just type the name of the variable and the debugger will show you its value. For detailed instructions on using the debugger, check out debug gem's documentation.
That's a wrap. I hope you liked this article and you learned something new.
As always, if you have any questions or feedback, didn't understand something, or found a mistake, please leave a comment below or send me an email. I reply to all emails I get from developers, and I look forward to hearing from you.
If you'd like to receive future articles directly in your email, please subscribe to my blog. If you're already a subscriber, thank you.