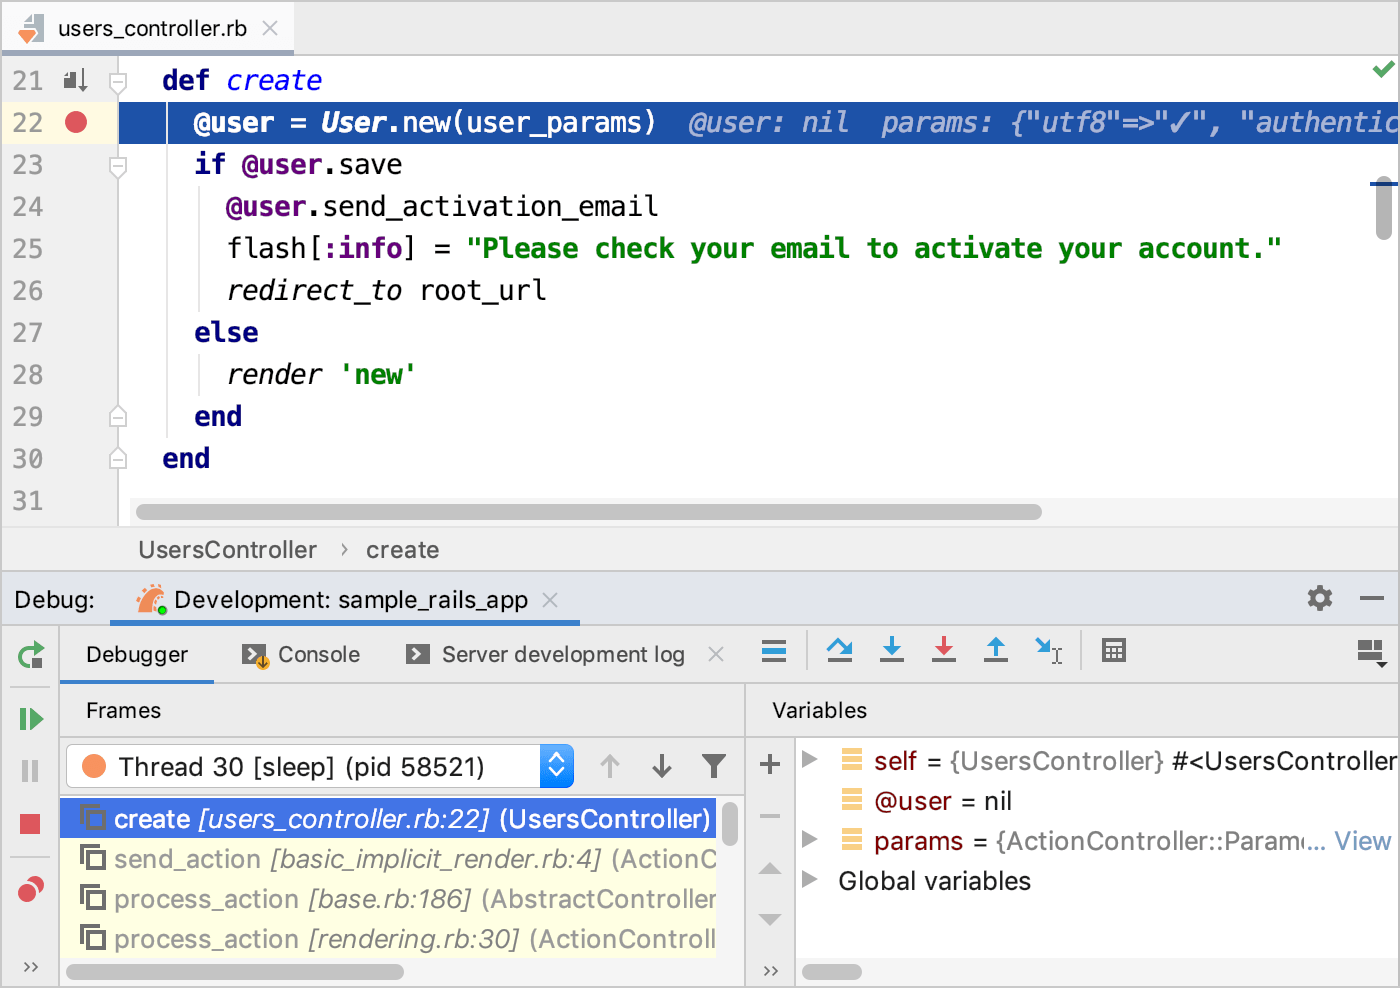
For a long time, I delayed learning Ruby as I didn’t know how to debug Ruby code. Coming from a .NET background, I was used to debugging C# in Visual Studio, with its powerful support of stepping in and out, dragging breakpoints, changing variables on the fly, and a myriad of features that made life easy for a C# programmer.
Since they used Textmate, I always thought that Ruby programmers debugged their code through a lot of puts calls. I didn’t want to do that since I was so spoiled by all these years of using Visual Studio.
Eventually, when I committed to learning Ruby and bought Intellij’s Rubymine IDE (along with the PickAxe book), I realized that it had almost 75% debugging capabilities of Visual Studio, which was fantastic. It helped a lot when I was learning Ruby and wrapping my head around metaprogramming.
After I started working professionally with Ruby and Rails, I discovered another powerful way to debug Ruby code without using Rubymine.
It uses a terminal; it is much faster, more efficient, and more enjoyable.
As an added benefit, you can do most of the debugging without using a mouse, just typing as few keys as possible. Nowadays, I do all my debugging in the terminal without having to resort to Rubymine.
Prying the Code
For terminal debugging, we will use a gem called pry-byebug, which uses two debugging gems called pry and byebug.
As a Ruby developer, you must have used IRB, which stands for interactive-ruby. You type irb, which puts you in a Read-Eval-Print loop right in the terminal, where you can execute any valid Ruby code.
Pry offers similar features. Typing pry in the terminal puts you in the interactive console, similar to IRB. In here, you can run any ruby command. For a complete list of features, check out the official documentation.
You can also use pry for debugging Ruby code.
Debugging using Pry
Here's a simple Ruby script that adds up two numbers and prints their sum.
require "pry-byebug"

class Sandbox
  def add(a, b)
    sum = a + b
    sum
  end
end

puts "Welcome to the Sandbox"

binding.pry

box = Sandbox.new
sum = box.add(3, 4)

puts "Sum = #{sum}"
Notice the binding.pry statement at the bottom. This statement adds a breakpoint and tells Ruby to stop execution at that point.
At this point, we can examine the current state, step in and out of methods, and exit or continue the execution.
If you were to run this code in the terminal, you’d see the following code. Pry pauses the program, and the terminal is waiting for your input. Notice the arrow next to the line number, which tells you exactly where the control is.
➜  sandbox (main) ✗ ruby lib/sandbox.rb
Welcome to the Sandbox

From: /Users/akshayk/Dev/ruby/sandbox/lib/sandbox.rb:15 :

    10:
    11: puts "Welcome to the Sandbox"
    12:
    13: binding.pry
    14:
 => 15: box = Sandbox.new
    16: sum = box.add(3, 4)
    17:
    18: puts "Sum = #{sum}"

[1] pry(main)>
Type next on the terminal to go to the following line.
[1] pry(main)> next

From: /Users/akshayk/Dev/ruby/sandbox/lib/sandbox.rb:16 :

    11: puts "Welcome to the Sandbox"
    12:
    13: binding.pry
    14:
    15: box = Sandbox.new
 => 16: sum = box.add(3, 4)
    17:
    18: puts "Sum = #{sum}"

[1] pry(main)>
Type step into the terminal to step inside the add method. Pry will take you inside the add method.
[1] pry(main)> step

From: /Users/akshayk/Dev/ruby/sandbox/lib/sandbox.rb:6 Sandbox#add:

    5: def add(a, b)
 => 6:   sum = a + b
    7:   sum
    8: end
During debugging, you can examine the local variables by typing ls in the terminal or simply typing the variable’s name. For example, typing a shows the a variable’s value.
[1] pry(#<Sandbox>)> a
=> 3
Type up to step out of this method, which takes you up a level in the stack. I do this a lot, especially when I find myself in the framework code while debugging.
[2] pry(#<Sandbox>)> up

From: /Users/akshayk/Dev/ruby/sandbox/lib/sandbox.rb:16 :

    11: puts "Welcome to the Sandbox"
    12:
    13: binding.pry
    14:
    15: box = Sandbox.new
 => 16: sum = box.add(3, 4)
    17:
    18: puts "Sum = #{sum}"
To continue the execution until the control hits the next breakpoint, type continue. Type exit to exit debugging.
If you're tired of typing next, step, and continue, just create a ~/.pryrc file and add the following shortcuts to it:
if defined?(PryByebug)
  Pry.commands.alias_command 'c', 'continue'
  Pry.commands.alias_command 's', 'step'
  Pry.commands.alias_command 'n', 'next'
  Pry.commands.alias_command 'f', 'finish'
end
If, at any point in time, you’d like to see where you are, type @ or whereami, and pry will show you the current breakpoint. You might find this helpful when you are reading the help (by typing help in the terminal while debugging) and seeing where you were in the execution.
That’s pretty much how you debug Ruby code.
It may seem a lot, especially if you are used to Visual Studio-like debugging style. But trust me, you will be debugging really fast once you get enough practice. And we just scratched the surface here. Pry offers many, many more advanced features that you’d find very helpful (I am still learning) and that will make you a productive developer.
And that’s how you debug Ruby code. I hope it helps.